

Look at a section
Click an item of spatial data on the map, and its store opens across the whole page: one section, every cell over the tissue image. It is read in place: no copy is downloaded, only the pieces on screen. Pan and zoom as you would on a map. The color legend, the image's channels and an overview of the whole section are drawn on the image itself.
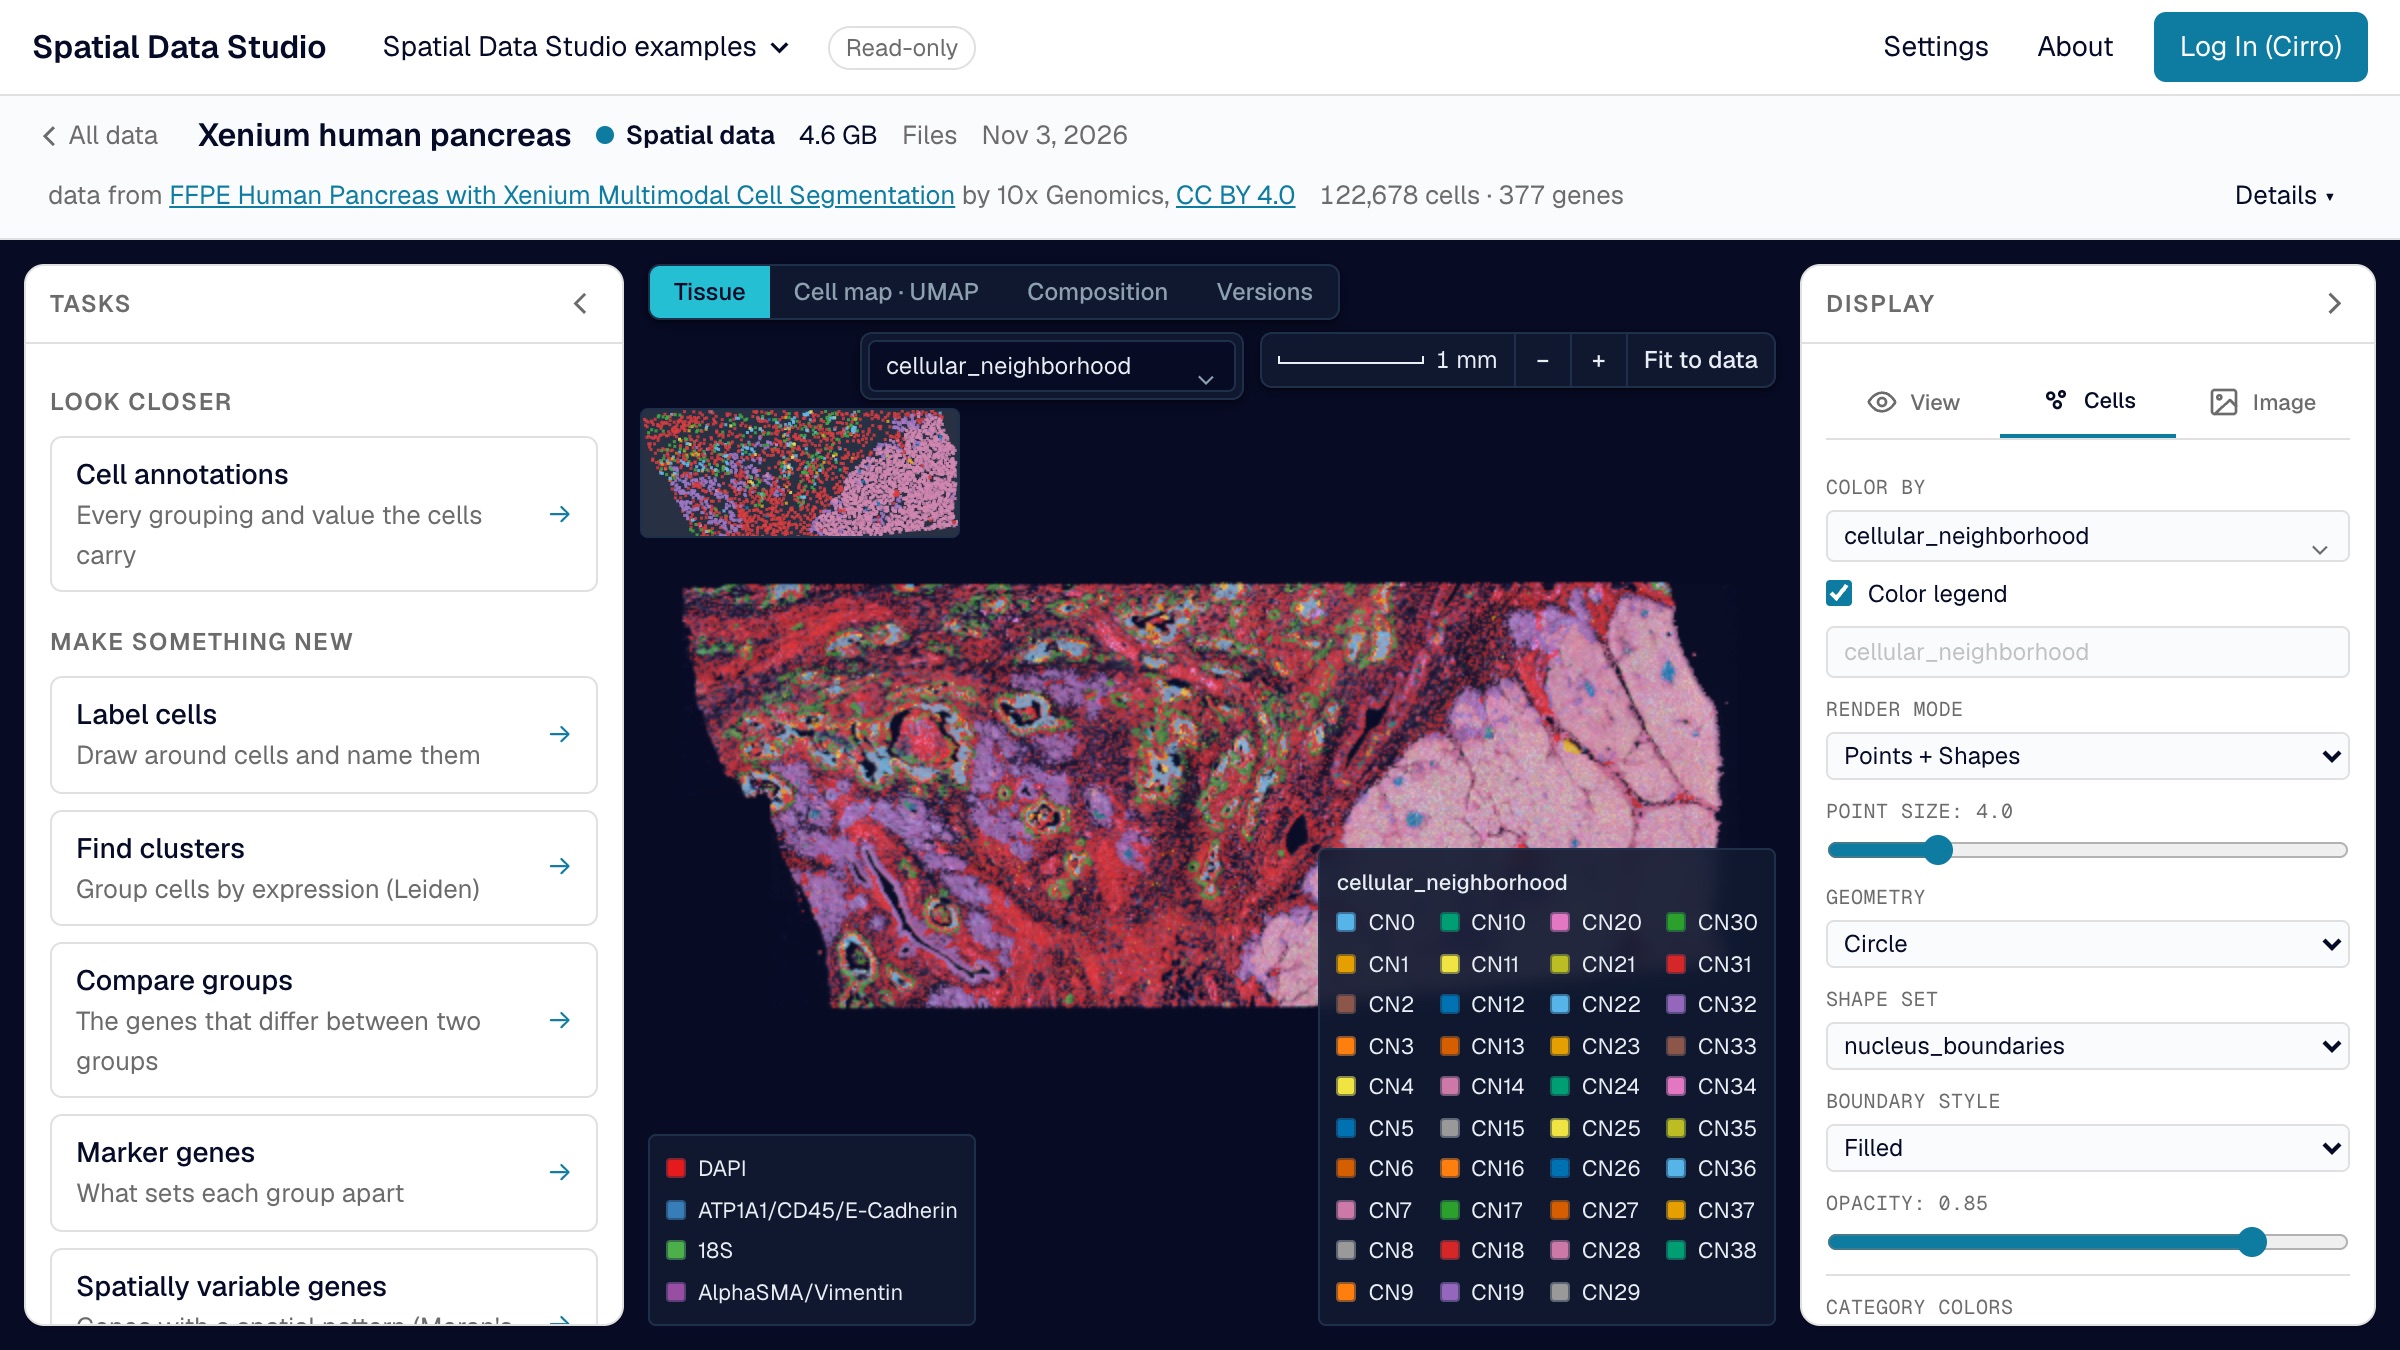
The line above it starts with the way back to the map, names the store, its size and where it came from, counts its cells (spots, for Visium) and genes, and links the run or image it was made from and what it was made into. A version shows as Version N · its title beside the name of the store it was saved on, and keeps that store's credit. Esc closes menus and an open task, but never leaves the dataset: the way back does.
Tabs
Tabs over the top of the view switch what is shown:
- Tissue: every cell over the image.
- Cell map: the store's UMAP or other embedding.
- Composition: cells per group of the current color, or, with a column chosen under Across, how each of that column's groups is made up (Compare composition). A color of values rather than groups, or of more than 100 groups (too many to color), has nothing to count, and the view says so.
- Versions: the store's history, with the page to itself (it has nothing to set).
- Figures: a menu of the figures saved with it, when there are any.
A figure or report the store lists but whose data can't be read (a version copied somewhere without all of its files, say) stays in its menu, named with the reason, and can't be opened; the others open as usual.
Beside the tabs are Color by (the same box as in the Display drawer, below: type a gene's or an annotation's name and pick it), a scale bar (when the store says its coordinates are microns), zoom out and in, and Fit to data, which stay in reach when the drawers are away; when the view is narrow they move under the tabs. For a Visium store, whose observations are capture spots, the header, the map's tab, Composition and Label cells say spots rather than cells.
Drawers
Two drawers float over the view. Pull one in with its tab at the edge of the view and push it away with its arrow, or press [ for the left one, ] for the right one and \ for both at once; the app remembers which you keep open. In a window narrower than 1,100 pixels only one is out at a time.
- The left drawer holds the analysis tasks (Analyze in the browser).
- Display, the right drawer, holds the display settings, the same panel with the same names as in an Analysis Workspace: View (cells and image on or off, mirroring, zoom, the overview, fit), Cells (first Color by, with the color range when the color is a number, and the color legend and its title; then render mode, point size and shape, the cell boundaries and their style, opacity, and each category's color) and Image (which image, a light or dark backdrop, and each channel's color, contrast and name).
Color by is one search box: click it to list the store's annotations, groupings first, or type a gene's name to find it. Arrow keys and Enter pick from the list and Esc closes it. When the store has layers, Gene values below it picks whether a gene is read from the expression matrix or from one of them.
How a section first opens
A store first opens with a light backdrop behind a stained (brightfield) slide and a dark one behind fluorescence, and the legends and overview take the backdrop's colors. It opens colored as it was saved, unless that color has a single group (a column every cell shares), in which case it opens colored by its first grouping with 2 to 50 groups. A store with no such grouping opens with its cells drawn as outlines (where it has cell boundaries), so the image shows through them. A gene or other number is colored from the 1st to the 99th percentile of the cells' non-zero values (from zero when some cells are zero), so a few cells with very high counts don't leave the rest of the tissue dark; cells past either end take its color, and the legend marks that end with ≥ or ≤. Color range sets the range by hand and Reset returns it. The tissue and the cell map share one color: choosing a color, its range, its legend title or a group's color on one changes the other. On Composition the drawer holds the color, which picks the groups counted, and Across, the column they are counted across.