

Introduction
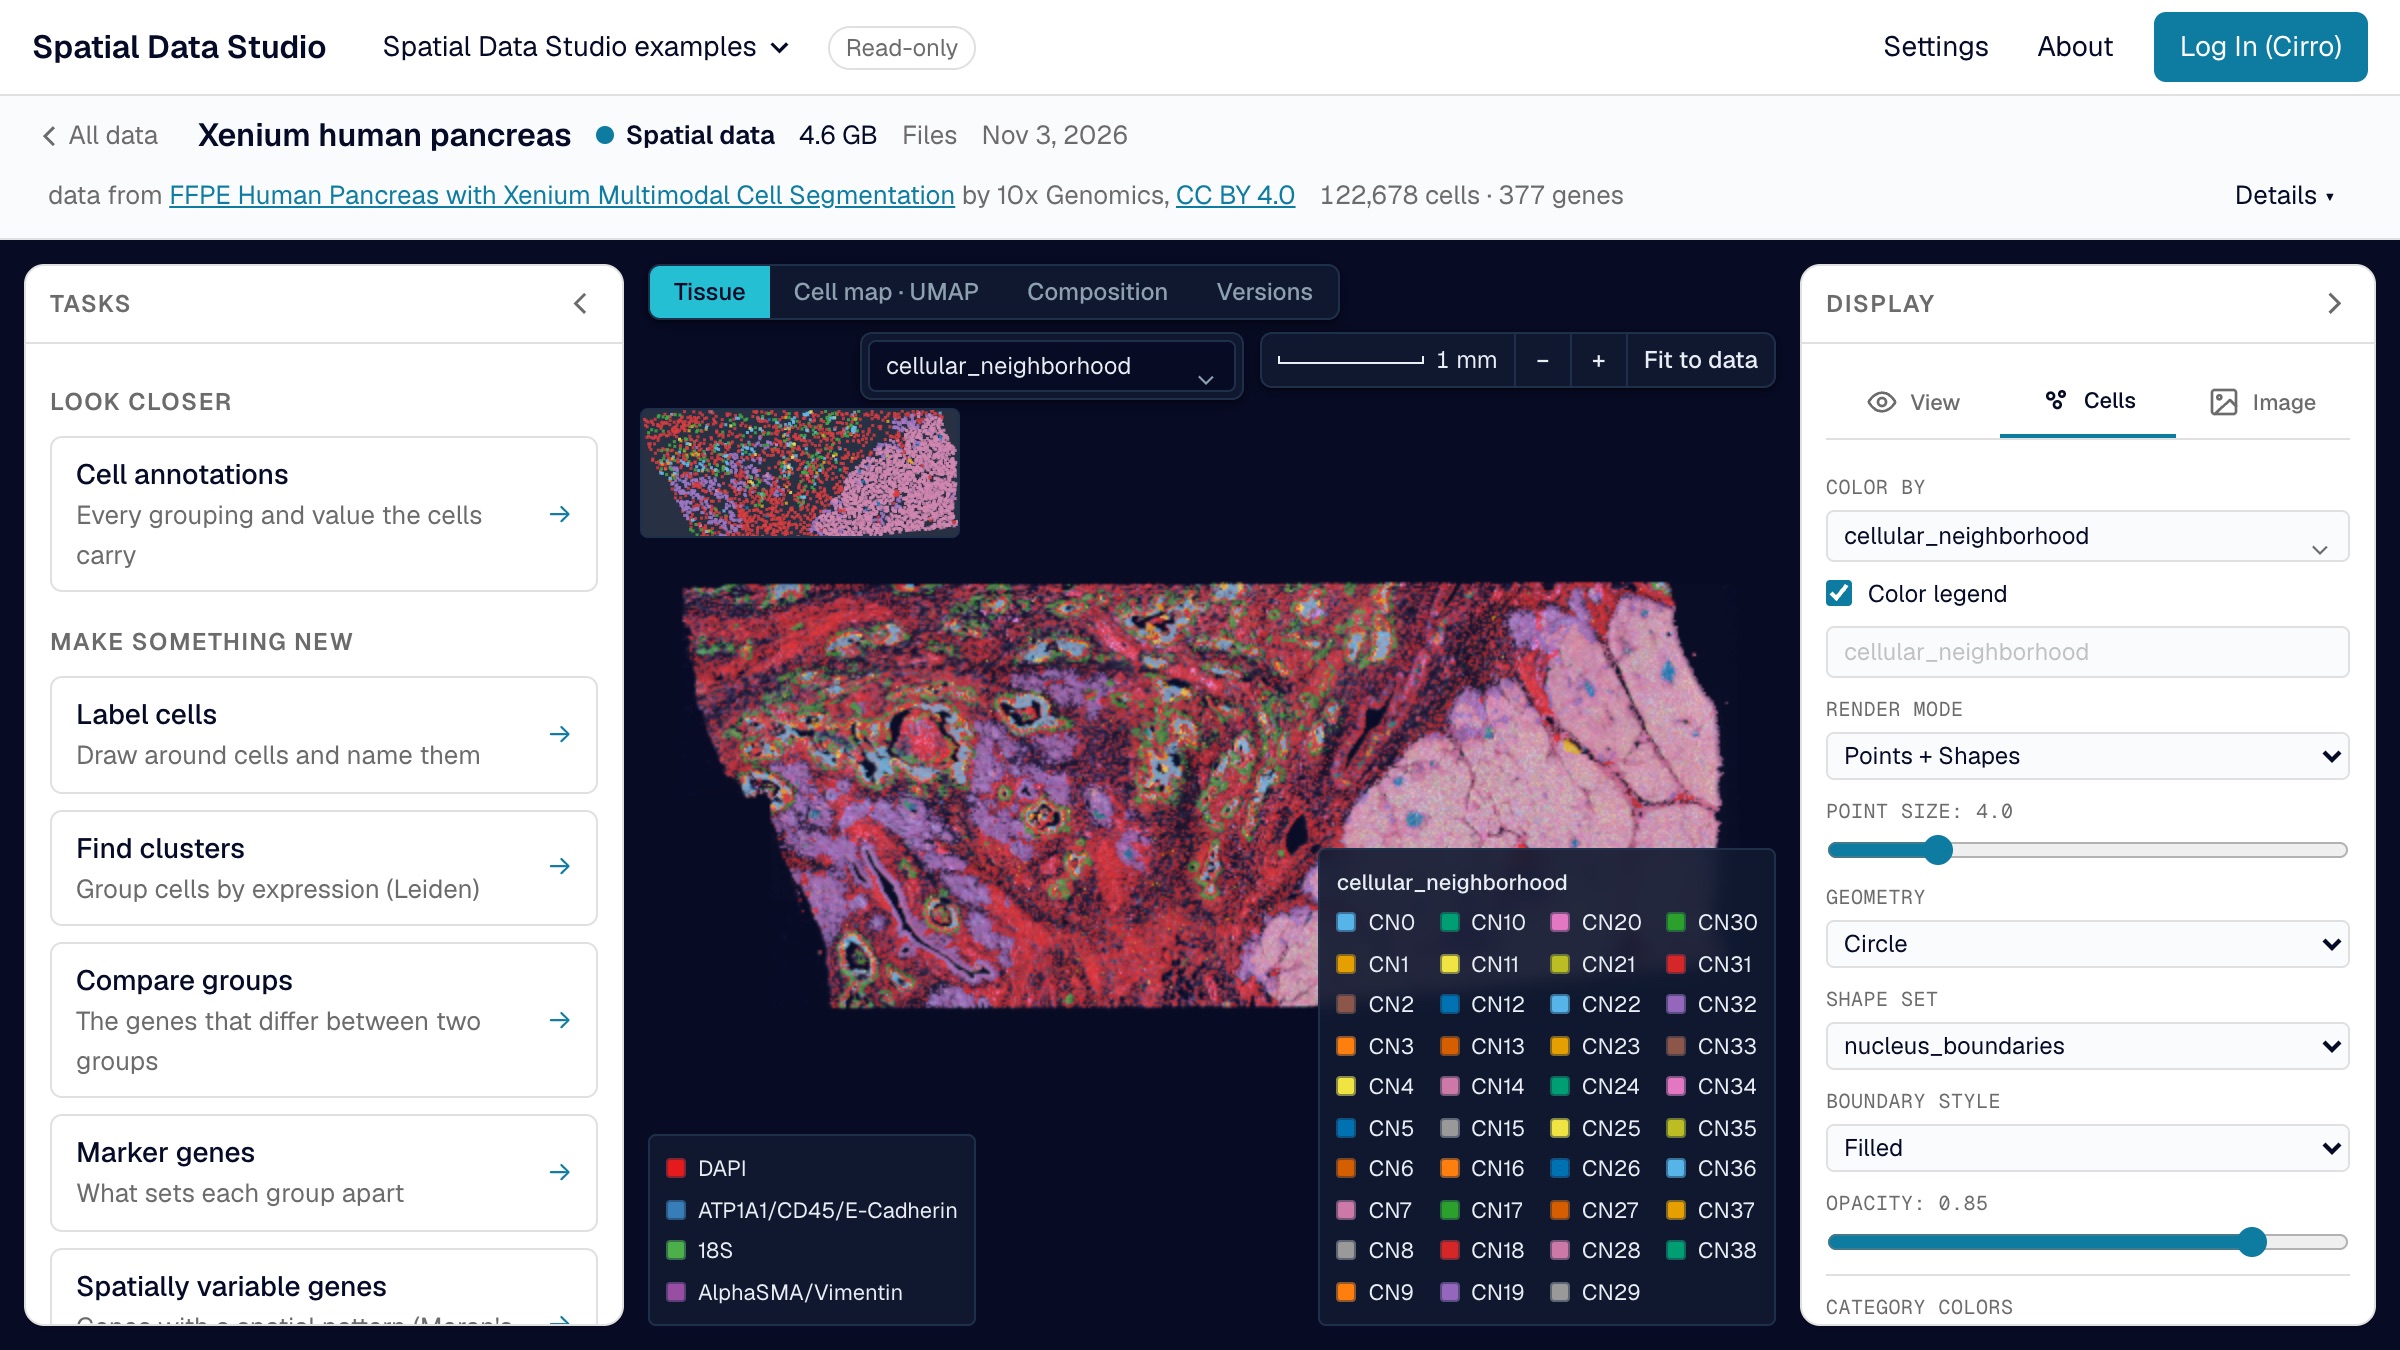
Spatial Data Studio is a web application for looking at and analyzing spatial omics data. That is a tissue section measured cell by cell (or spot by spot), with each cell's position, its gene expression and the microscope image it sits in. Open a section and see every cell over the image. Color the cells by a gene or a cluster, compare regions and cell types, and keep what you find, without writing code.
It reads Xenium, Visium, Visium HD, CosMx, MERSCOPE, and anything else SpatialData can read. Its analyses follow scanpy and squidpy, the standard Python tools for this data.
Three ways to use it
In your browser
Most people start with the web app, which needs nothing installed. It opens straight onto Spatial Data Studio's public sections. It has two kinds of data:
- Public Data anyone can open with no account, starting with Spatial Data Studio's own examples; Settings adds or drops others.
- Your Data (Cirro), once you log in to Cirro, the data platform Spatial Data Studio is built with. The app reads your data where Cirro stores it.
Both are organized into projects, each a collection of datasets. Every project works the same way, and is either one you can add to or a read-only one. In a project you can add to, what you make is saved back to it, where everyone on the project can open it and build on it. In a read-only one (every public project, and a Cirro project where your role lets you only view), the analyses still run, and what you save stays in your browser.
The web app, its viewer and this guide count visits with Google Analytics. Google is told which page you opened, without anything after the page's address, so never which dataset you opened, what you searched for or which Cirro you logged in to; how long the page was in view; and a random number your browser keeps so a return visit counts once. No Google code runs in the page and Google sets no cookies. An Analysis Workspace reports nothing.
In an Analysis Workspace
Some work needs more than a browser can give: a squidpy or scanpy function the web app doesn't offer, a recipe of several steps, or a section too big for your computer's memory. An Analysis Workspace is the server version of Spatial Data Studio, with every squidpy and scanpy function, running on a machine in your Cirro project. You start one from the web app with the datasets you choose, and colleagues can join it once you share it. You can also run one on your own computer with Docker.
Inside another page (advanced)
The viewer that draws a section is also something you can put on another web page: a link that opens a saved section with nothing running behind it, a folder of sections on any web server, or a frame in a dashboard.
Which one do I need?
| You want to | Use |
|---|---|
| See what the app does, or explore public data | the web app, as it opens |
| Show your own data to anyone, with no account | a folder with an index.json, added in the web app's Settings (Show your own data) |
| Link to one of your datasets from your own page, with the analyses | the web app, opened on the file's address (Link to your own dataset) |
| Look at and analyze your own data, and share results with your team | the web app, logged in to Cirro |
| Run a squidpy or scanpy function the web app doesn't offer, or a recipe | an Analysis Workspace, started from the web app |
| Work on data on your own computer, or have an AI assistant drive the app | an Analysis Workspace, run with Docker |
| Show a saved section on your own site or dashboard | the viewer |
In this guide
- Public Data: what public data is, choosing which public projects to list, showing your own data, and whose data it is.
- Your Data (Cirro): logging in, what the app finds in a project, adding data, pipelines, saving versions, and working as a team.
- Find a dataset: projects and access, the four stages of data the app works with, and the map.
- Look at a section: an opened section, its tabs, the two drawers, and how it first opens.
- Analyze in the browser: the analyses, their reports, figures, how the results compare with scanpy and squidpy, and what to cite.
- Link to your own dataset: a link that opens one dataset in the web app from wherever you host it, presigned URLs included, and how to prepare the file.
- Analysis Workspaces: starting one, sharing it, and everything it adds.
- Run it with Docker: an Analysis Workspace on your own computer, and the AI assistant.
- Share and embed the viewer: links to a saved section, hosting a collection, and putting the viewer on another page.
- Words this guide uses: project, store, version, checkpoint and the other words the guide uses in a particular sense.